Every time you open up Custobar you are welcomed with Custobar's dashboard, which gives you a quick overview of what is going on in your customer base. In this article, you can find a basic description of all the features you see in the dashboard and links to the specific articles about information provided.
Main navigation
On the top of the page, you can find the main navigation and the sub-navigation of Custobar. Learn what they include and how they function in other articles:
Performance dashboard
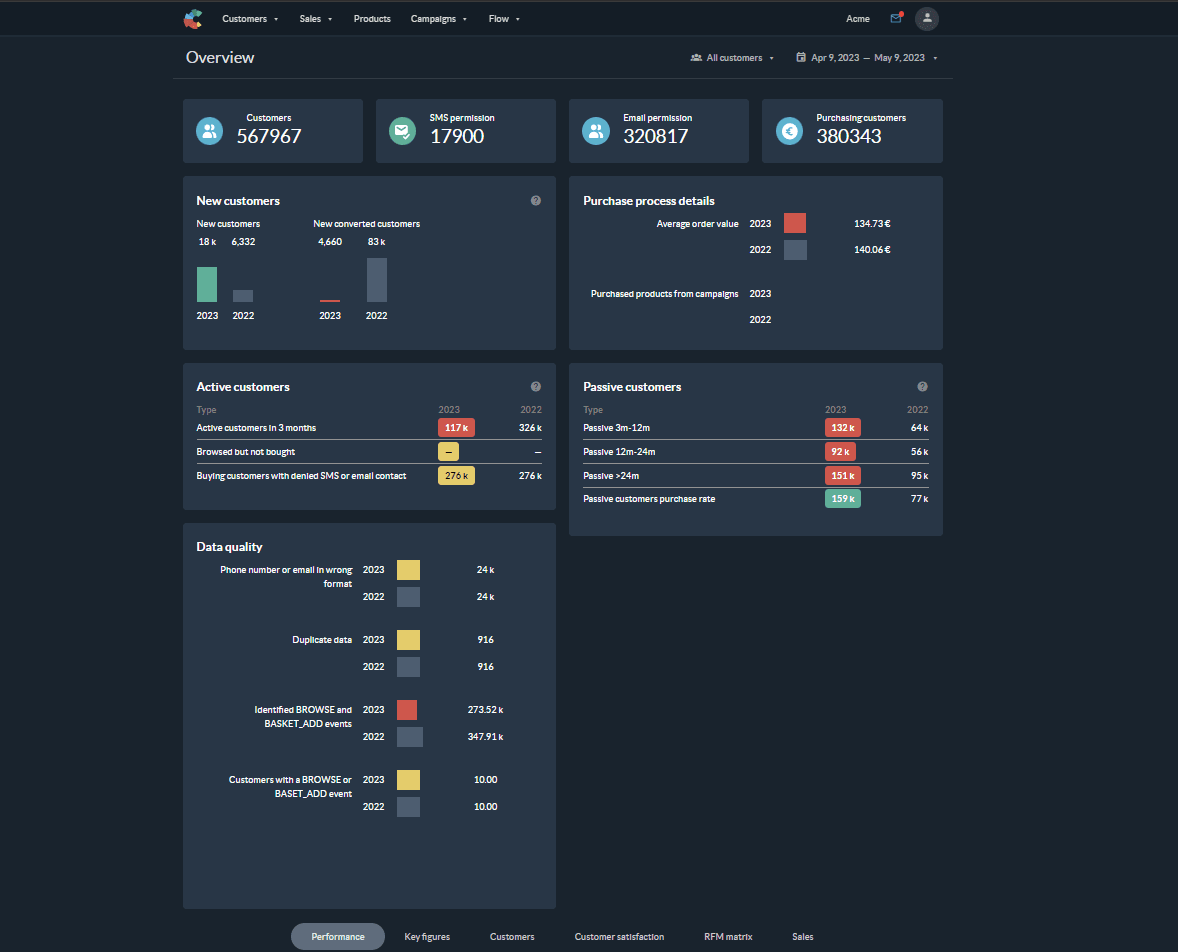
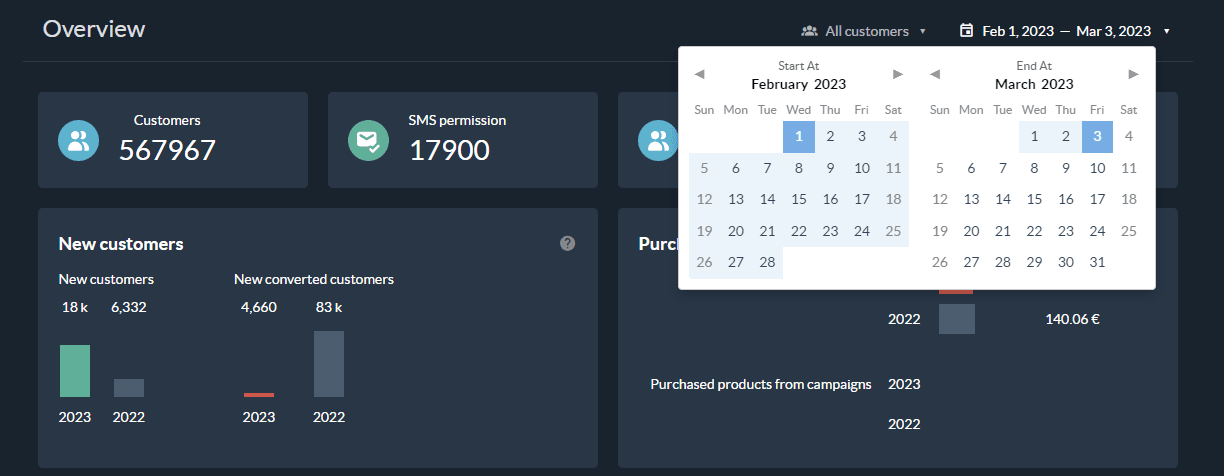
The performance dashboard gives you a set of important KPIs and metrics to monitor your customer base and your campaigns performance. The reporting is by default applied to the entire customer base and over a time window of the last 30 days, but it is possible to define a different timeframe, or select a saved audience to review.
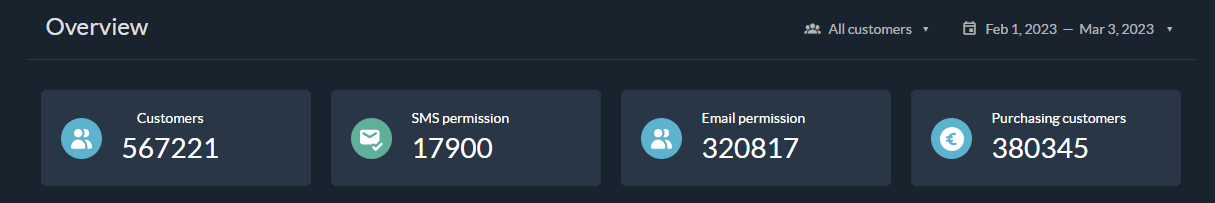
The top row of attributes is however always showing the current state of things based on your data regardless of the time window selected, and new data imports will update those attributes.
They are:
- Customers: Your entire customer base
- SMS Permission: The number of customers who gave their consent for SMS campaigns
- Email Permission: The number of customers who gave their consent for Email campaigns
- Purchasing Customers: The number of customers with at least one purchase
Below these attributes, we find the first metrics indicating performance. The cards will each show different categories of metrics with a year-over-year comparison showing the state of that metric for the same period one year ago.
They are:
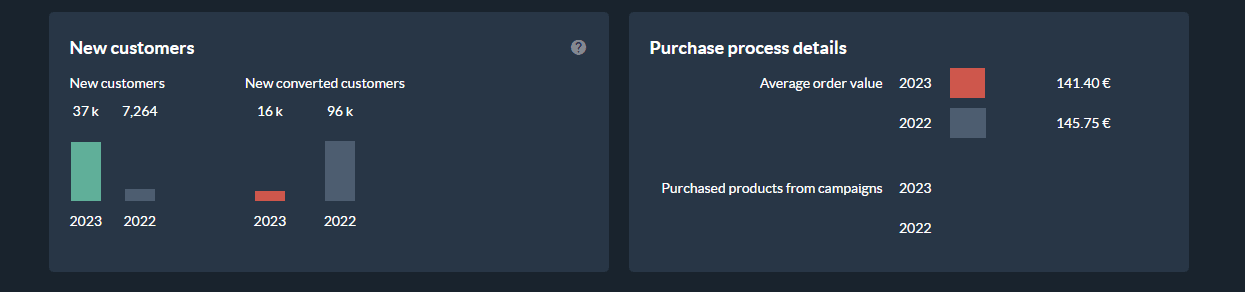
- New customers: This card gathers data about newly created customer profiles in Custobar
- Purchase process details: This covers metrics about your customer's basket
Next we have:
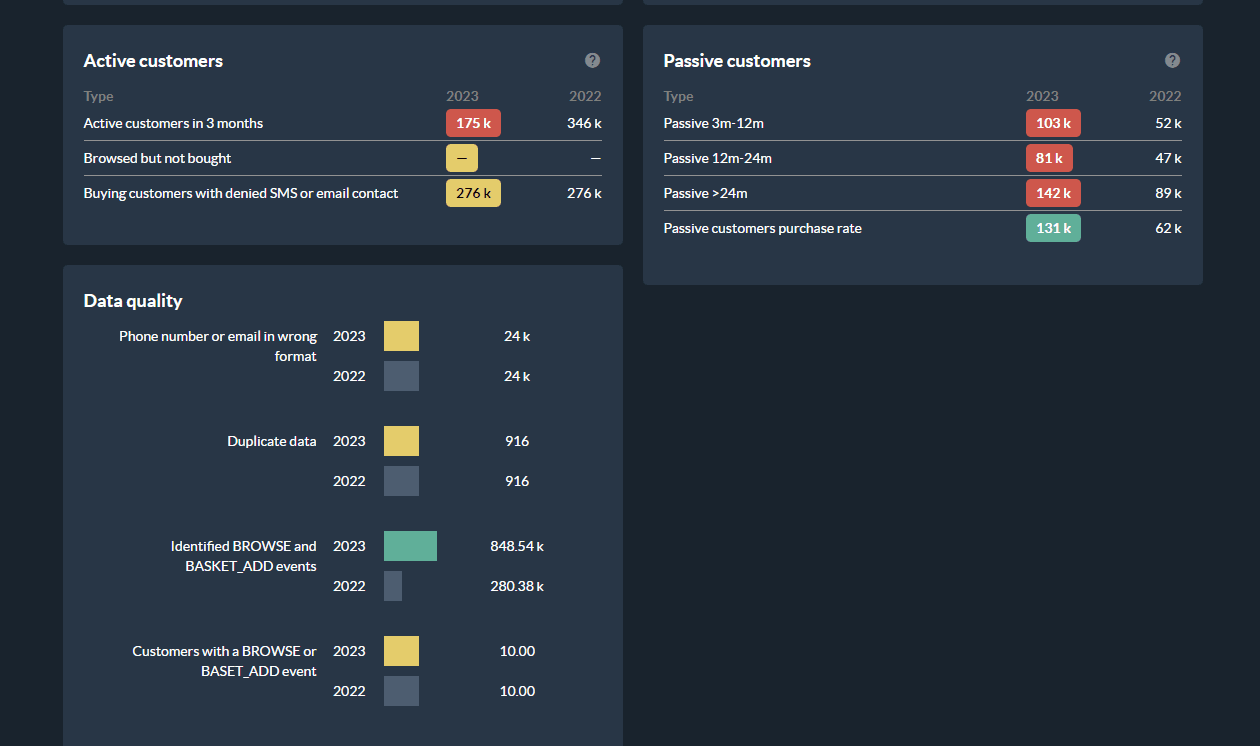
- Active customers: This card looks at metrics about your recently active customers
- Passive customers: This card gives you a breakdown of the passive customers
- Data quality: Here we try to offer more insights about the general health of your data and actionable touchpoints
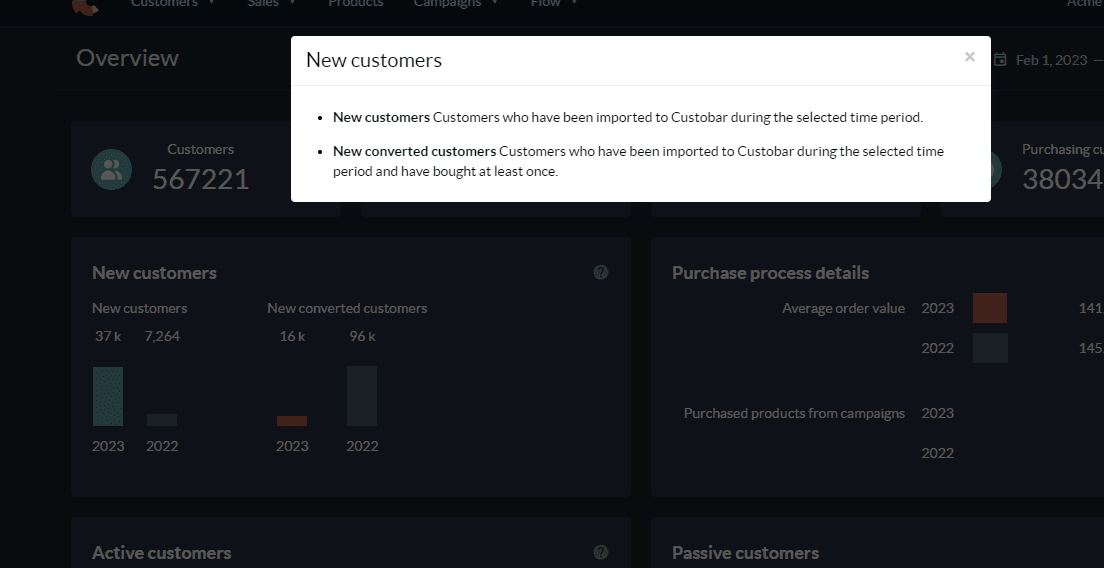
Some cards have a question mark icon, click it to get more information about the metrics.
KPI tiles
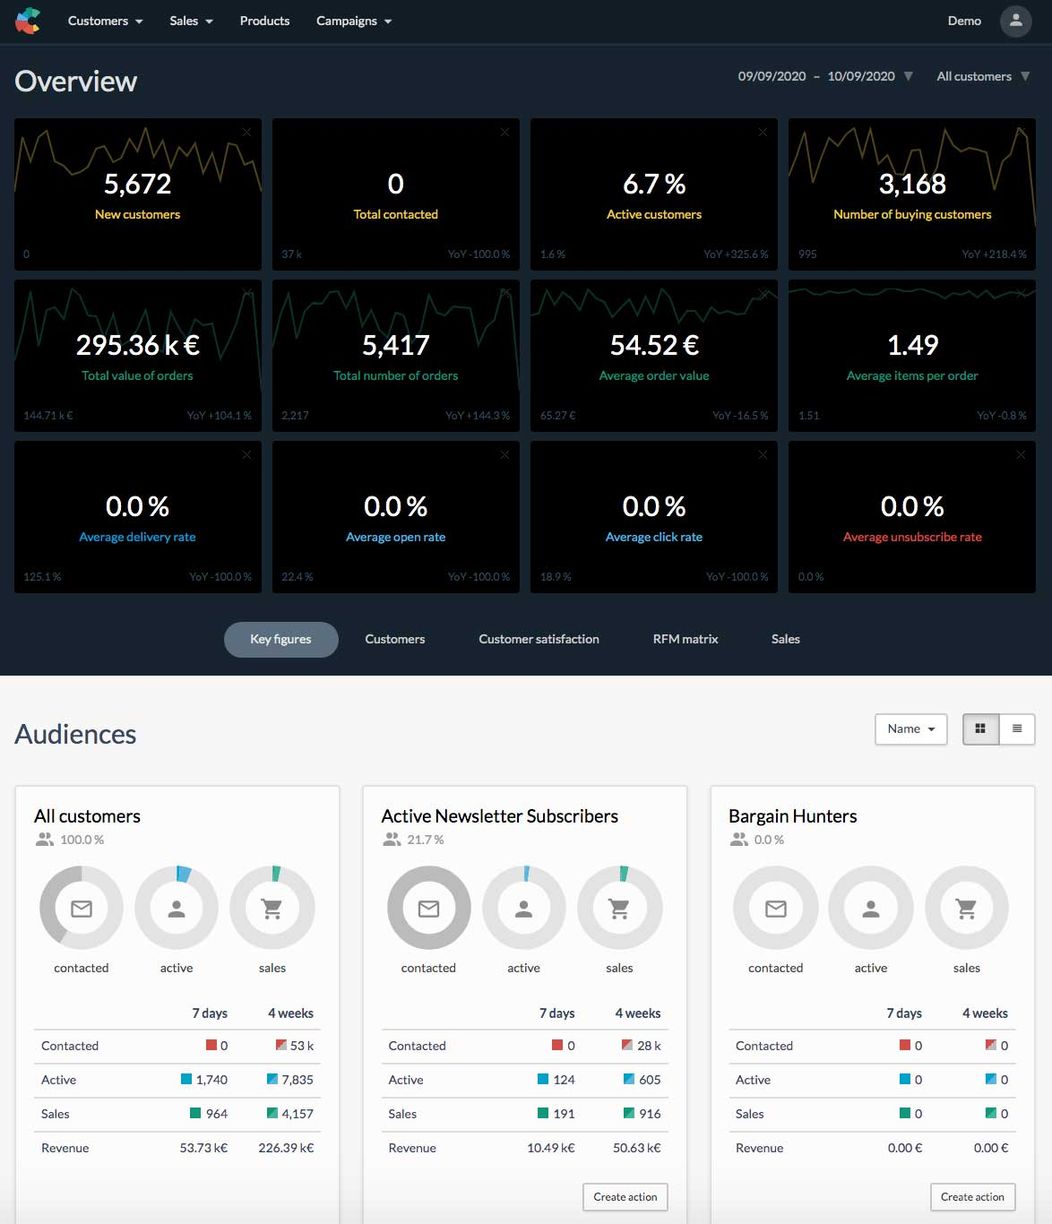
- New customers: Total of new customers in Custobar in the period.
All customers have cb_created_at value which is created when the customer is imported to Custobar for the first time. - Total contacted: Total of customers contacted in the campaign over the period.
- Active customers: Total of customers clicking, browsing, buying or opening in the period.
- Number of buying customers: Total of customers who made a purchase in the period.
- Total value of orders: Total monetary value of the orders in the period.
- Total number of orders: Total of sales in the period.
- Average order value: Average monetary value of all sales in the period.
- Average items per order: Average of items in all sales over the period.
The next ones apply to the email campaigns:
- Average delivery rate: Average delivery rate over the final audience size.
- Average open rate: Average open rate over the delivered messages.
- Average click rate: Average click rate over the delivered messages.
- Average unsubscribe rate: Average unsubscribe rate over the delivered messages.
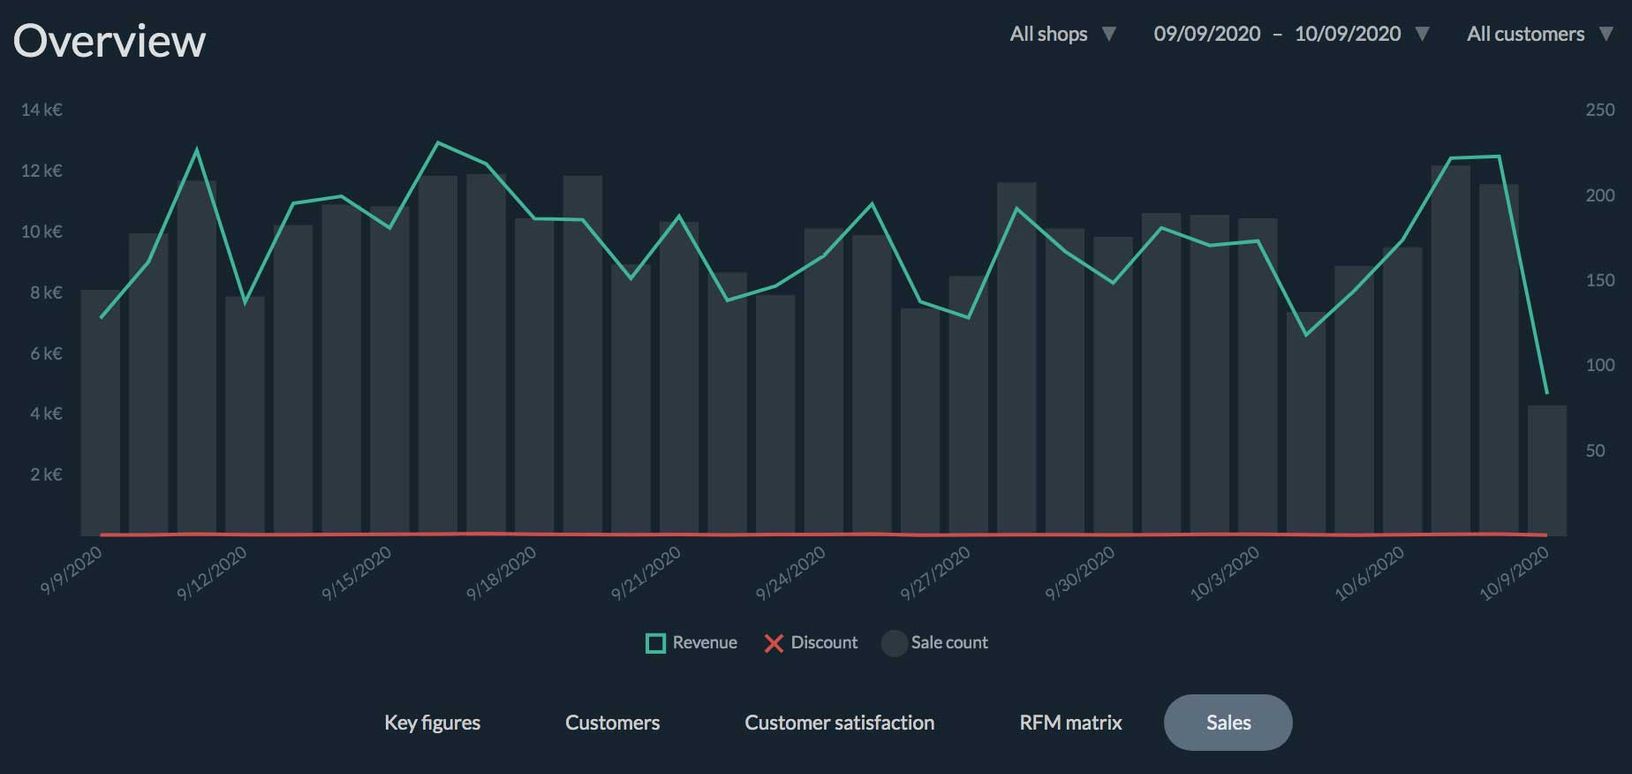
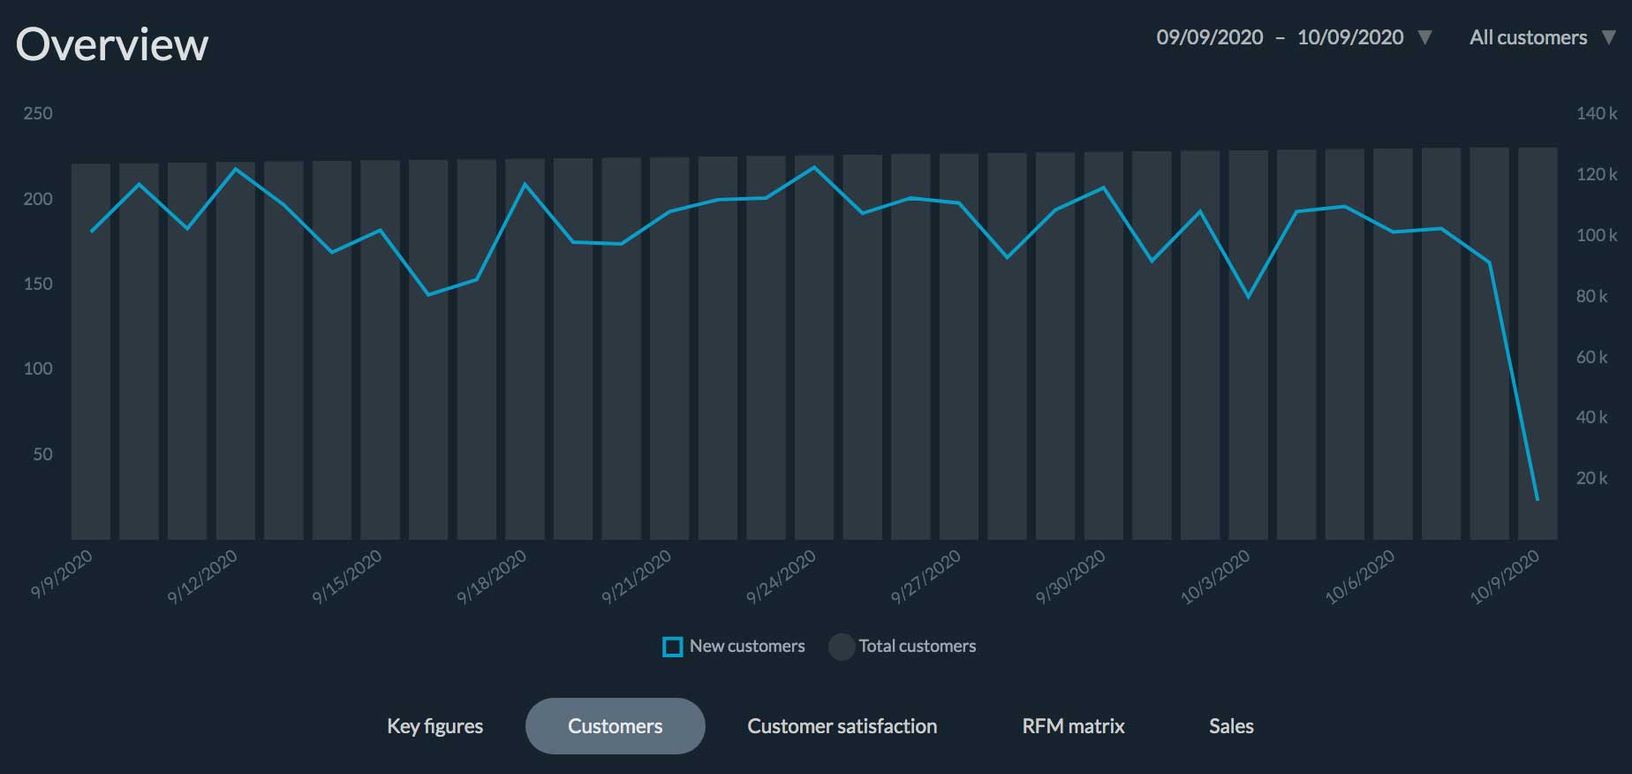
Key performance indicators (KPI)
Here you can find the real-time data of the most important KPI’s of your customers. You can switch for example from the total customer population and its evolution to the RFM matrix to identify trends within your customer base. This is done simply by clicking the tab button.
RFM matrix
The Recency-Frequency-Monetary matrix is a data visualisation tool to analyse your customers' behaviour based on real-time customer data.
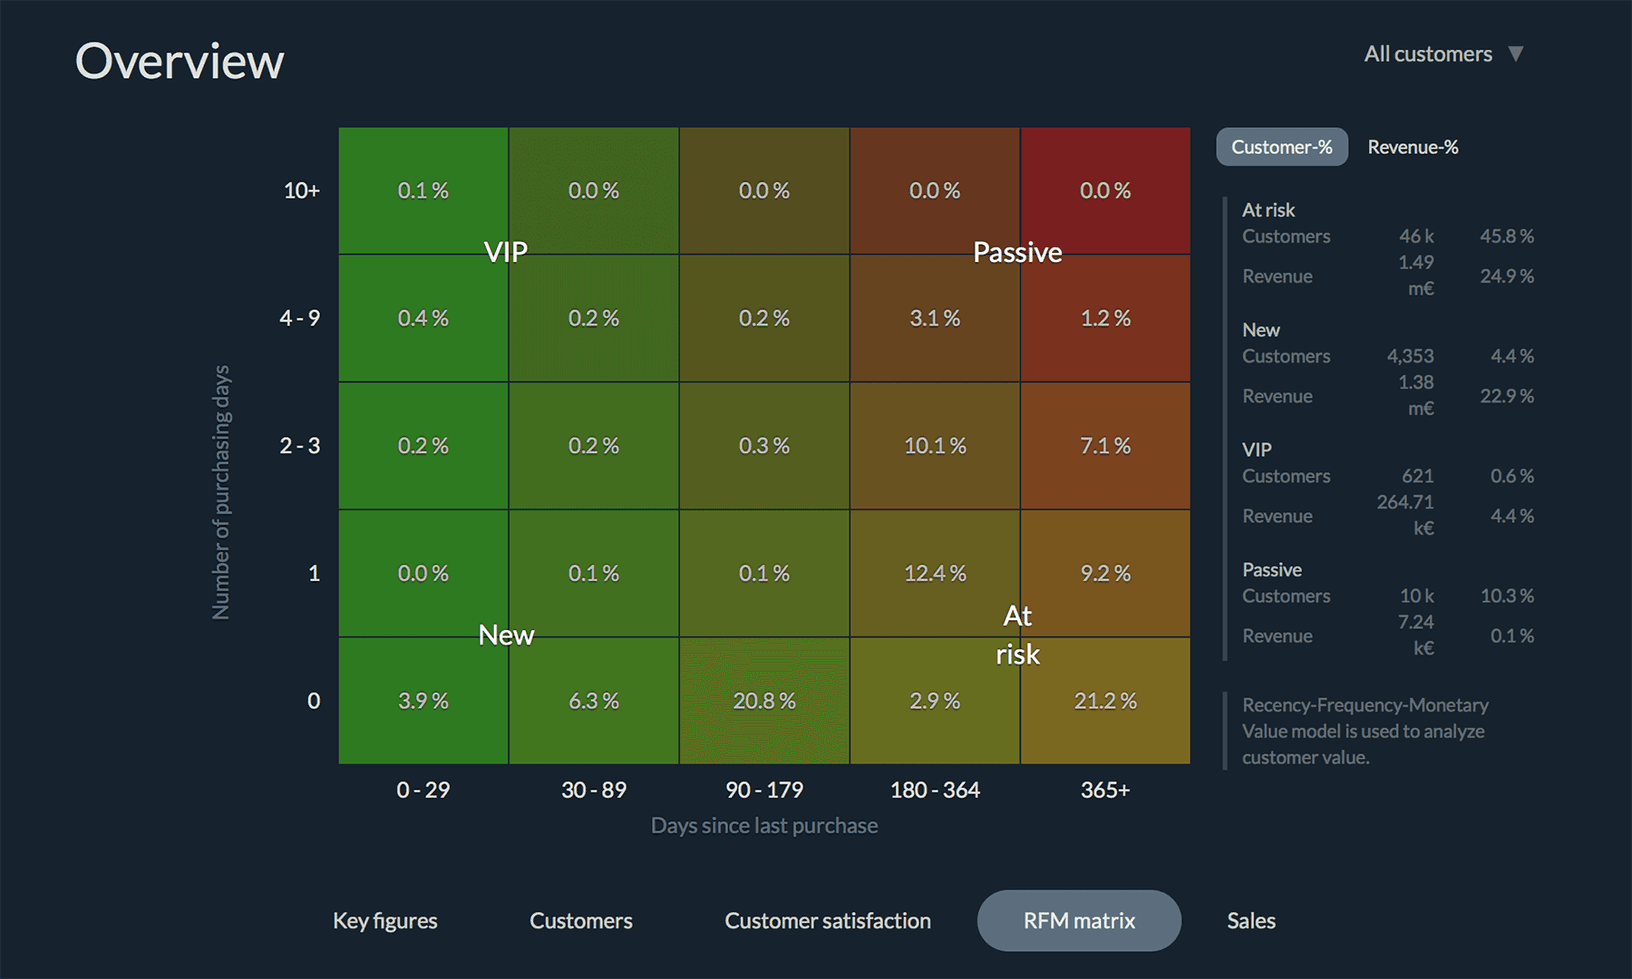
Custobar’s RFM matrix allows you to identify your new, VIP, passive and “lost” customers based on when they have been active and how often they have purchased, and quickly launch campaigns to reach these different groups. You can identify and compare these groups and immediately see where the most revenue is coming from.
The terminology used in the RFM data is the following:
- Recency – The freshness of the relationship between your brand and your customer; based on the date when your customer last made a purchase from you (online or offline)
- Frequency – The measure of demand; how many times your customer has bought from you
- Monetary value – This can be seen either as a monetary value or the proportional value of every selected group of customers compared to the rest
The RFM matrix shows data for all customers, but it can also be set up to split specific audiences data if you want to keep a close look at selected segments of your customer base. It is possible to add specific audiences to the RFM matrix and you can contact Custobar support to learn more.
Customer satisfaction (NPS) survey
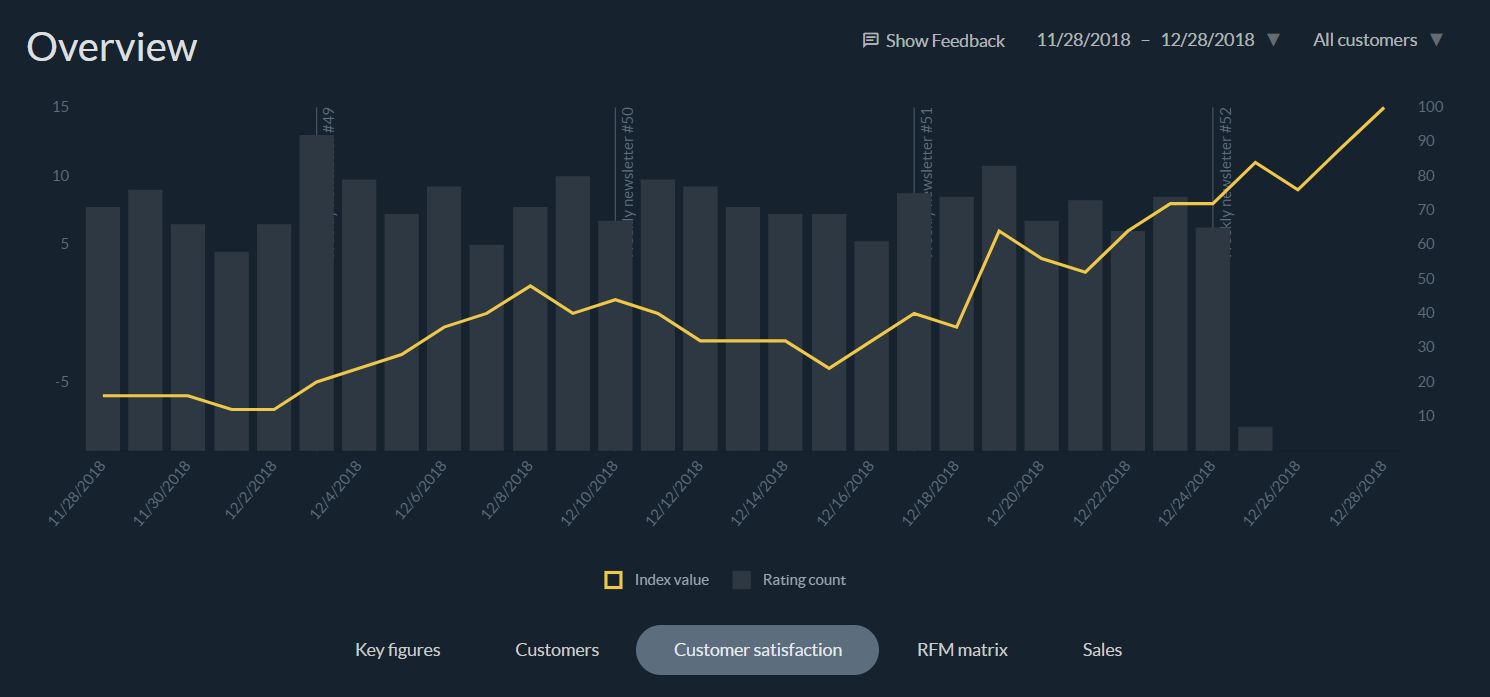
"How likely is it that you would recommend [brand/company] to a friend or colleague?" This simple, widely used research-based survey allows you to make comparisons both within your company and against the standard within your industry.
Note! Custobar offers this feature for an additional monthly fee.
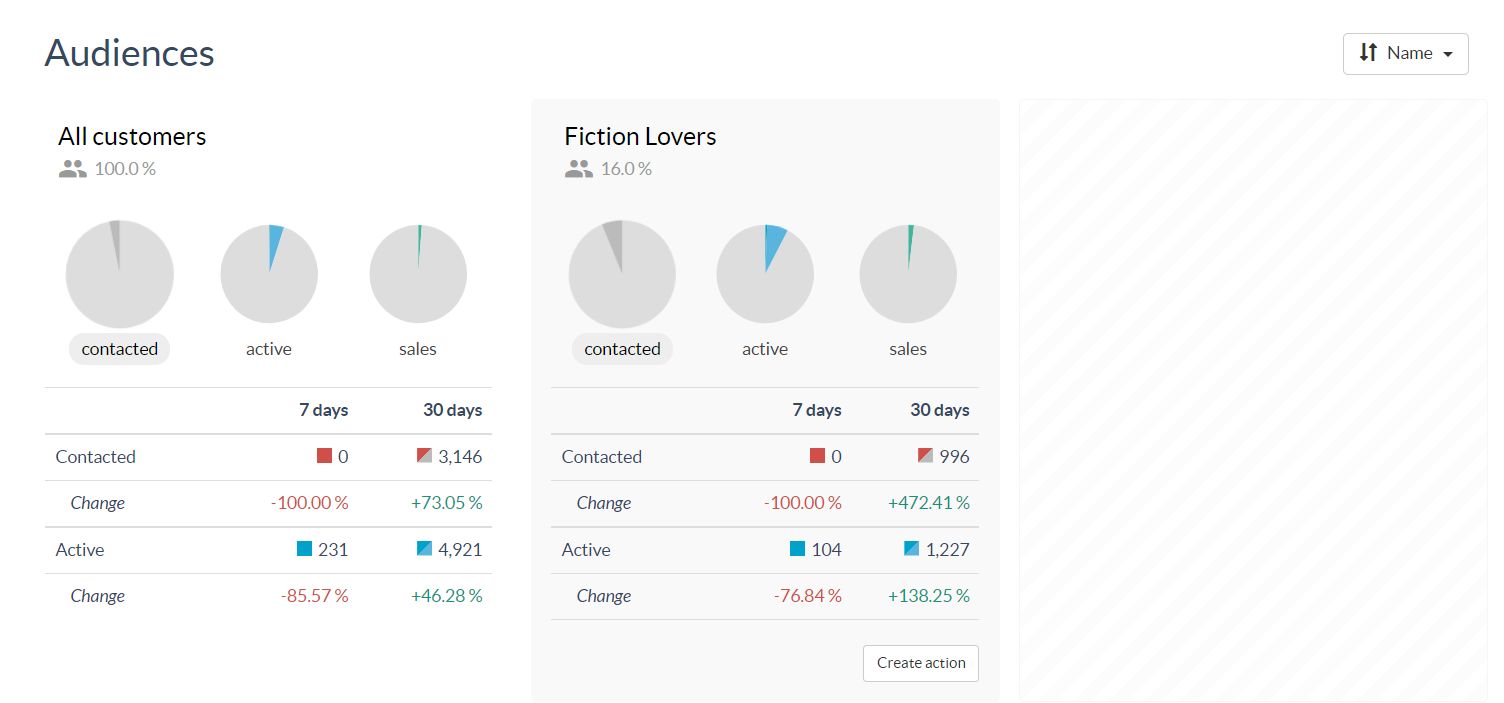
Audiences
Here you can see a quick summary of the KPIs for your saved audiences. Just like for the RFM matrix, it is possible to add specific audiences to the KPI's and you can contact Custobar support to learn more.