We all know that getting new customers is vital to keep the business growing. What’s equally important is retaining the customers you already have acquired by using your valuable time and resources. But to improve your customer retention, you need to know how to measure it. Meet the cohort analysis!
In this user guide we’ll go through what the cohort is all about and how you can use it to improve customer experience and sales. At the end of the article, you will find more thorough instructions on how to use the cohort analysis in Custobar. If you are interested to learn more about the benefits of the tool, head to our cohort analysis blog.
What is a Cohort analysis?
Cohort analysis is the best way to track customer retention. It shows you how many customers are left at the end of each month after they initially purchased from you or were active in another way, for example, signed up for your loyalty program. In other words, it’s a tool you can use to observe and measure the behaviour of your customers over time.
How to read the cohort analysis?
The cohort analysis can be a powerful tool, but for that, one needs to be able to understand what they are looking at.
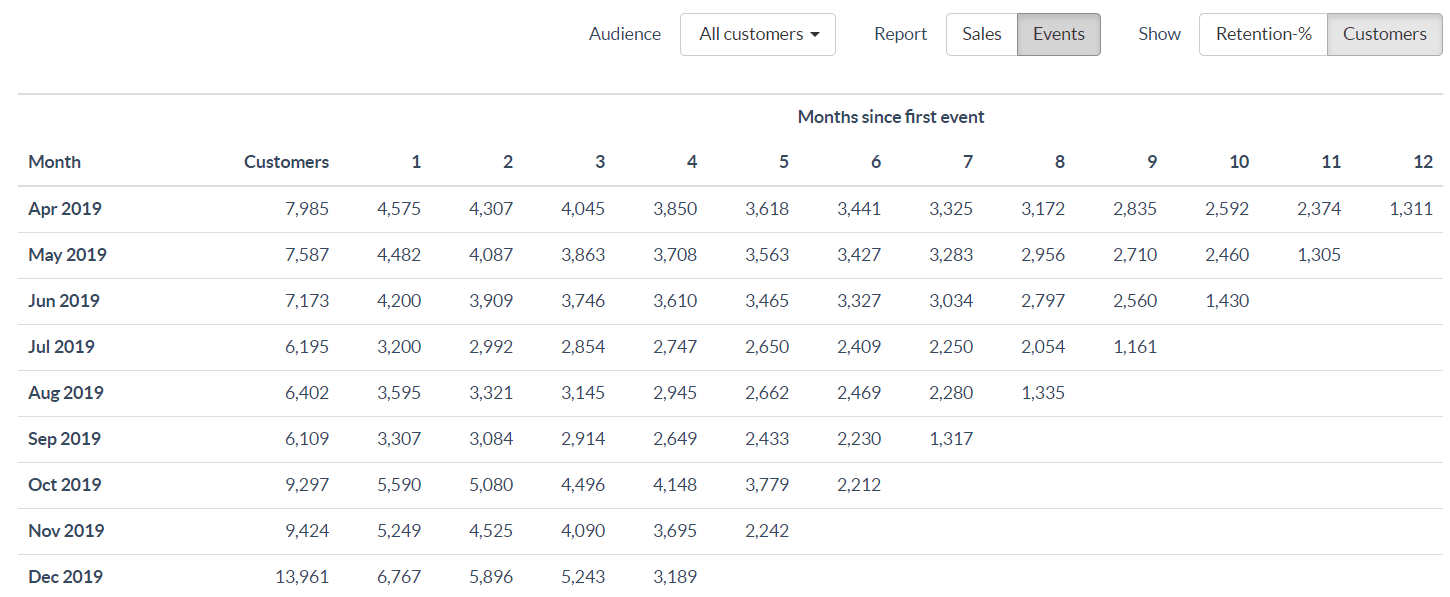
Let's take the example here to find out how to read it.
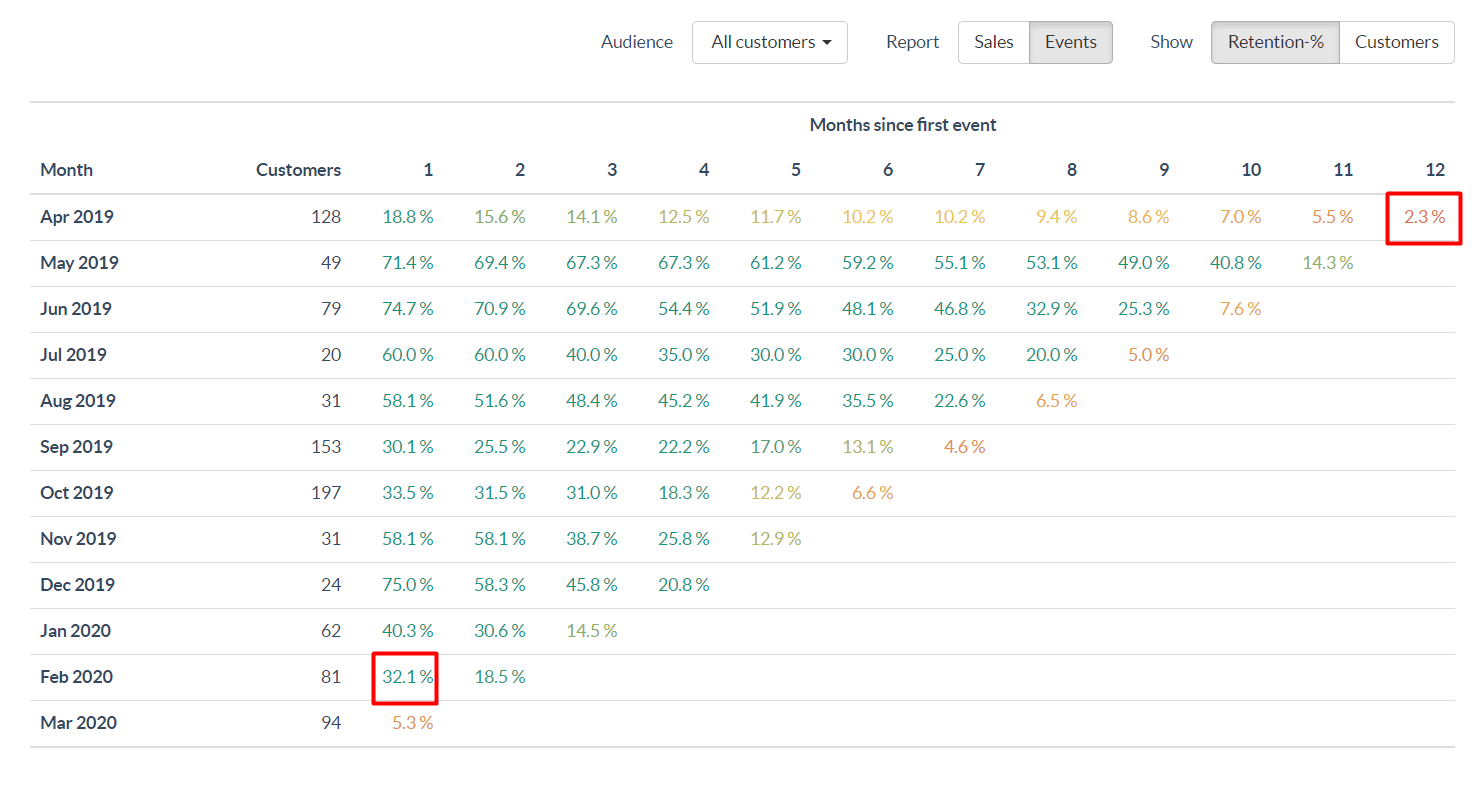
Those two highlighted numbers can be read as follow:
Out of the 128 customers who's first Event was on April 2019, 2.3% are still having events 12 months later.
Out of the 81 customers who's first Event was on February 2020, 32.1% did not have an Event beyond the first month and have probably churned.
Please note: Those figures are updated in real-time based on the available data in Custobar, and will update every time a customer has a Sale or Event. Also, the total of a row is higher than 100%. The reason for that is a customer who has not churned and is still engaging during month 12 will also be counted as "on board" during months 1 through 11 as well since they have not churned during those months.
Cohort analysis in Custobar
In Custobar, the cohort analysis breaks down the entire customer base or a selected audience in groups based on the time of their first purchase or activity event and presents the retention rate of those groups based on the time passed in months since that first action.
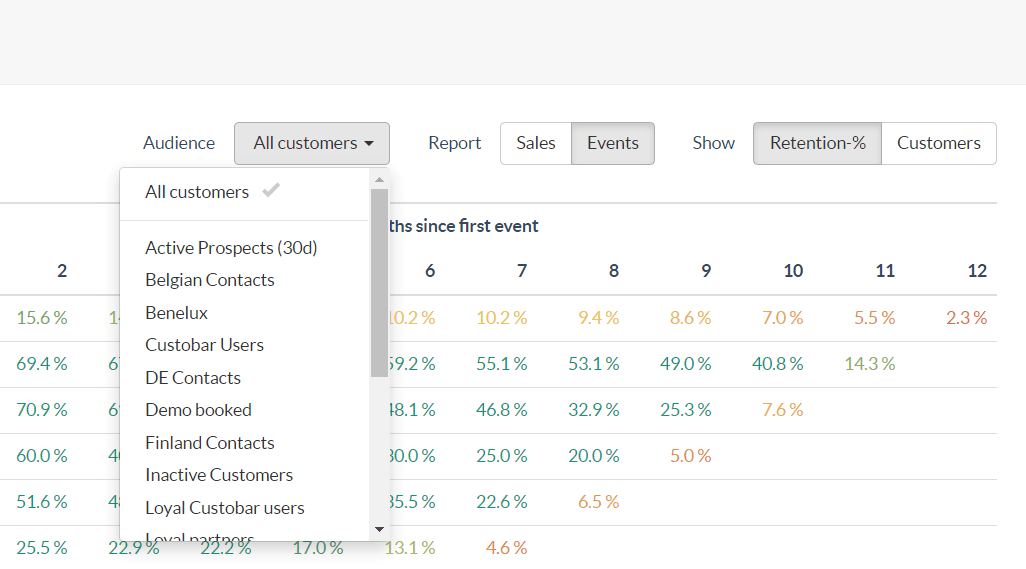
The cohort analysis can be displayed for the entire customer base, or for a saved audience. Audiences pinned to the dashboard will be showing as an option in the drop-down menu:
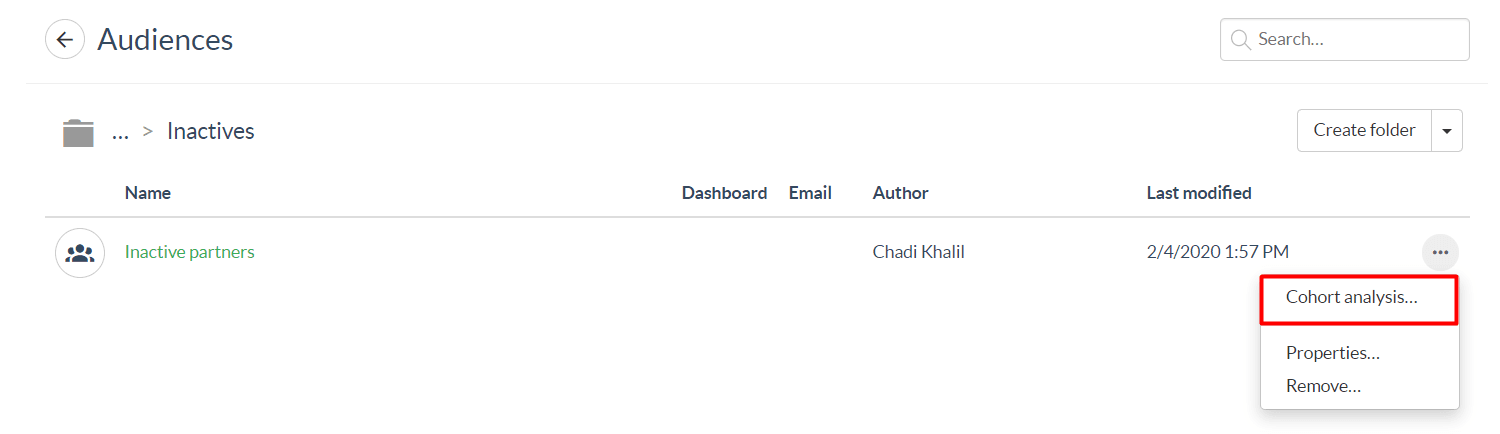
But it is also possible to access the cohort analysis of all other audiences from the audience folders:
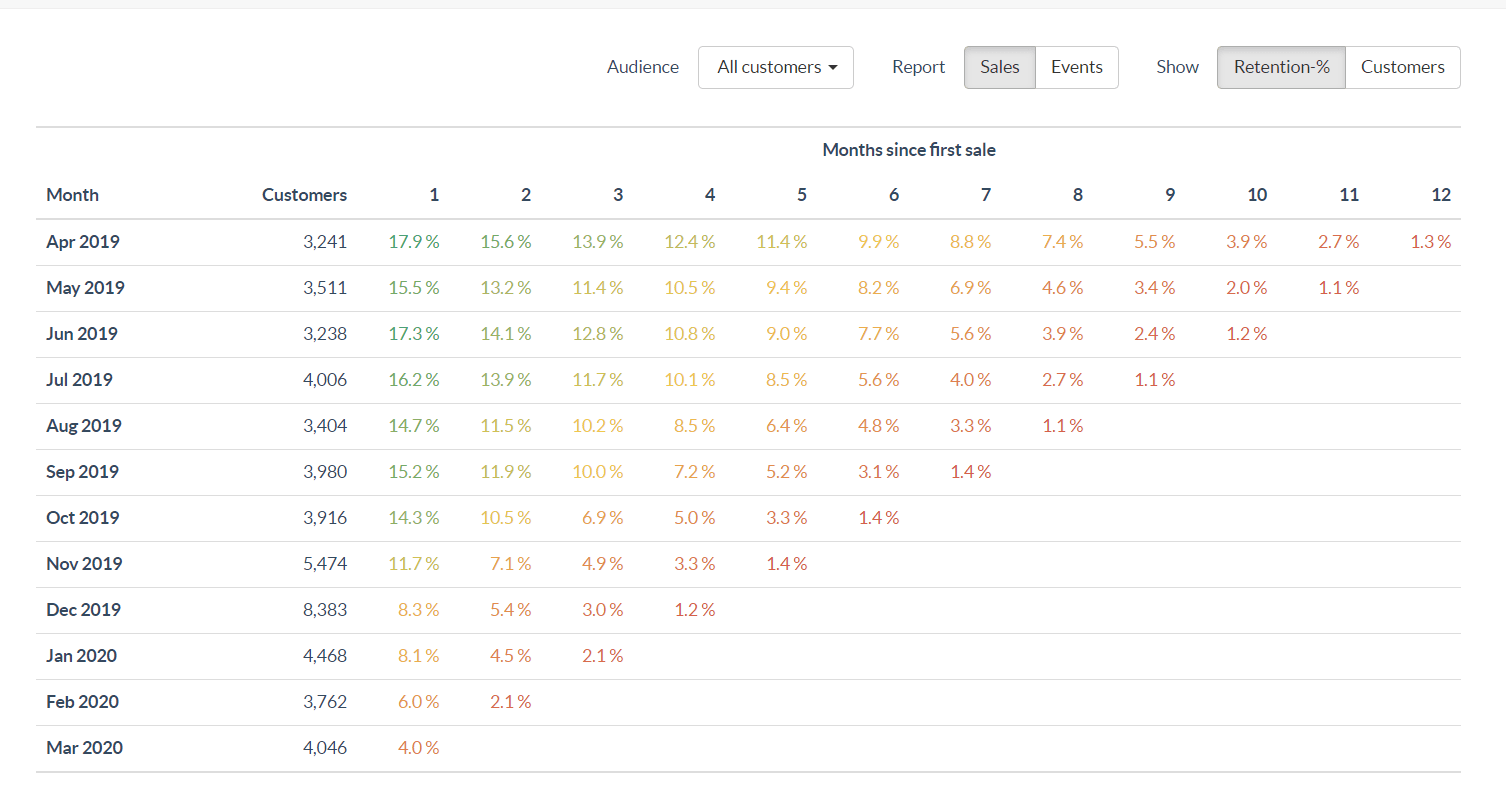
The cohort analysis can be configured to break down the audience based on the time since the first Sale, or the time since the first Event. In the case of Events, only activity events count. Those can be MAIL SUBSCRIBE, BROWSE, MAIL OPEN, etc.
The cohort can also be set to display the breakdown in percentage, or the actual customer counts for each row.
If you have any questions or concerns, please contact support@custobar.com
Sources:
- Coussement, Kristof. “Improving Customer Retention Management through Cost-Sensitive Learning.” European Journal of Marketing 48.3/4 (2014): 477–495. Web.
- Launch Day by Experience Commerce Finland