Together with the new Audiences for customer searches, we have updated the main Customers page view.
Overview
The layout of the customer detail view has been revamped to be more instinctive, provide key metrics in a quick glance, and help you get a more data-driven customer segmentation.
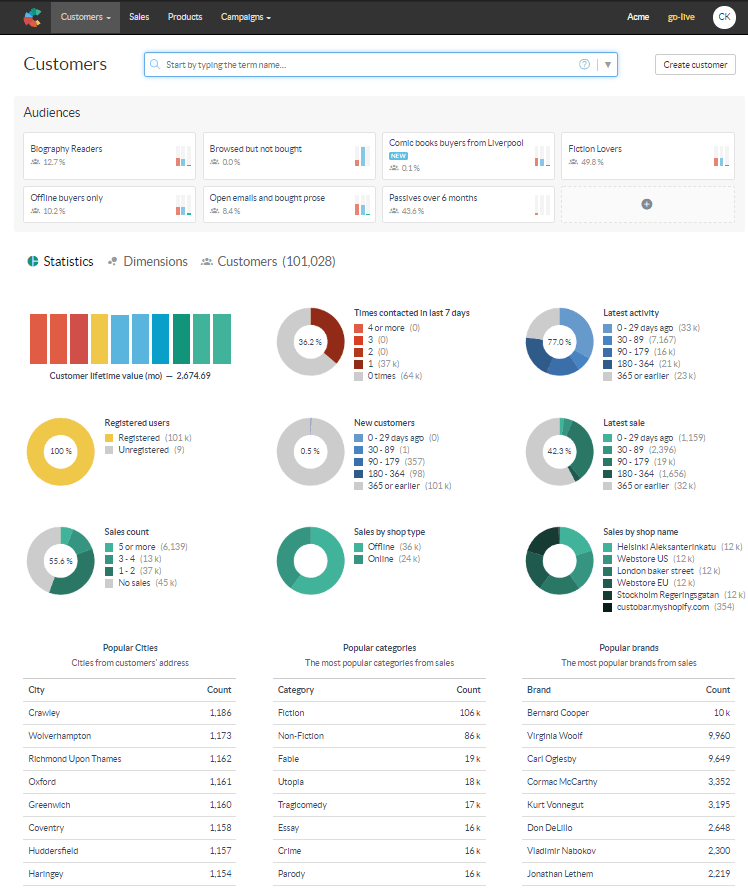
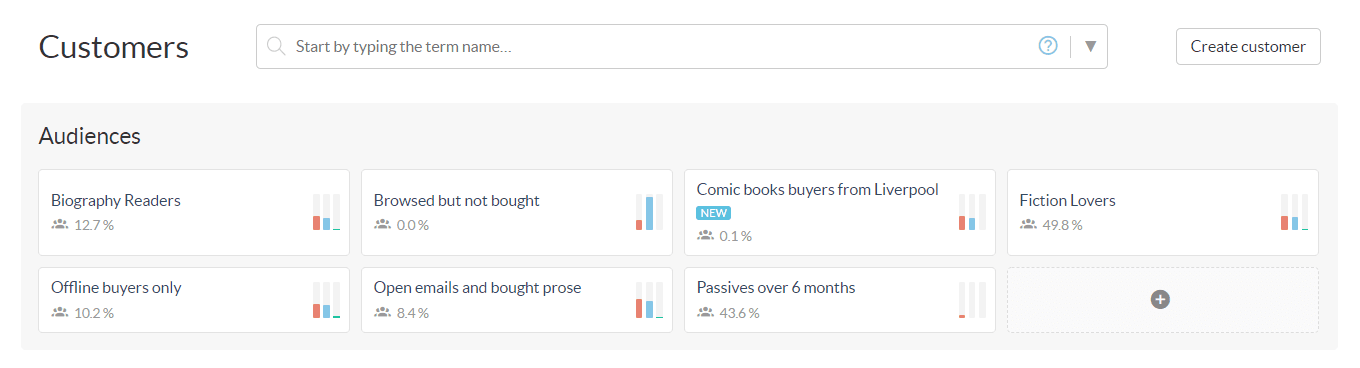
Audiences
The first section of the page is audiences. To find out more about these, please refer to this article. Selecting a specific audience will update the rest of the page to reflect the details of that audience. This is also where you will find the button to open the form for creating a new customer.
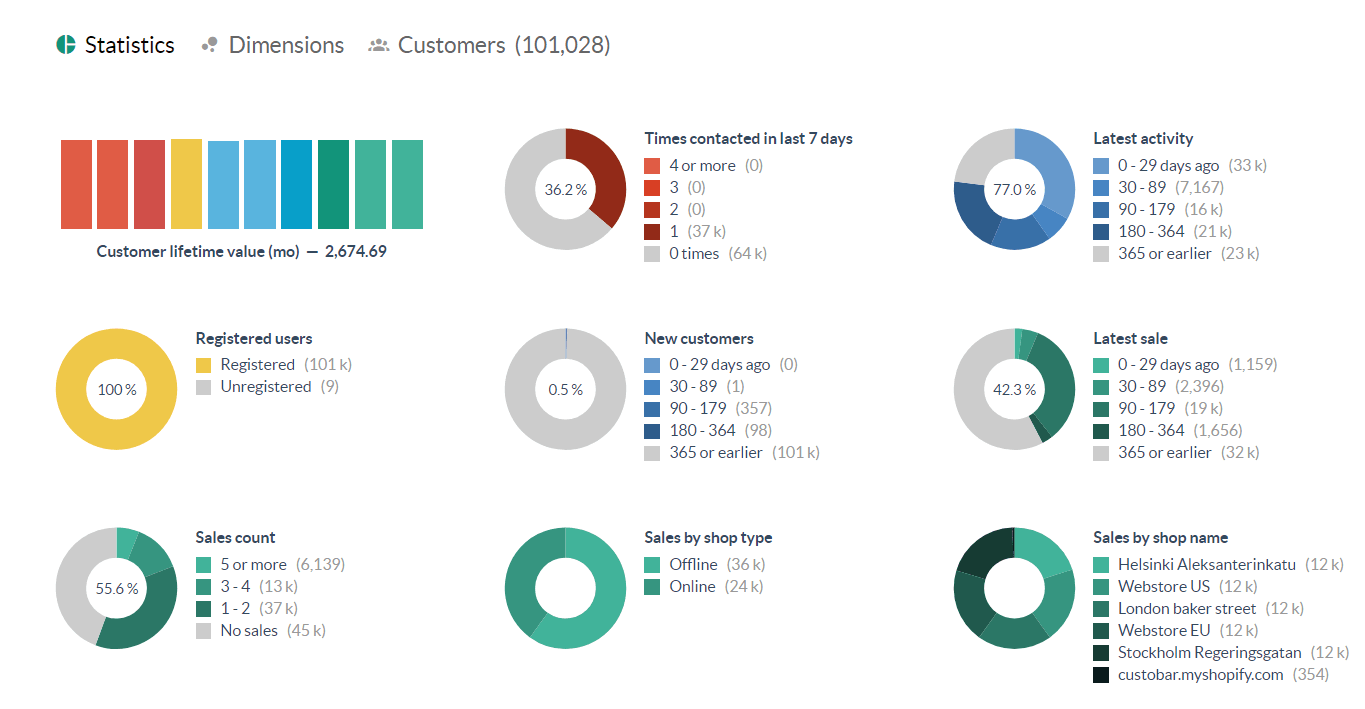
Statistics
The next section is the Statistics. These are key metrics displayed in a visual way to keep track of important statistics for your entire customer base, or a specific selected audience.
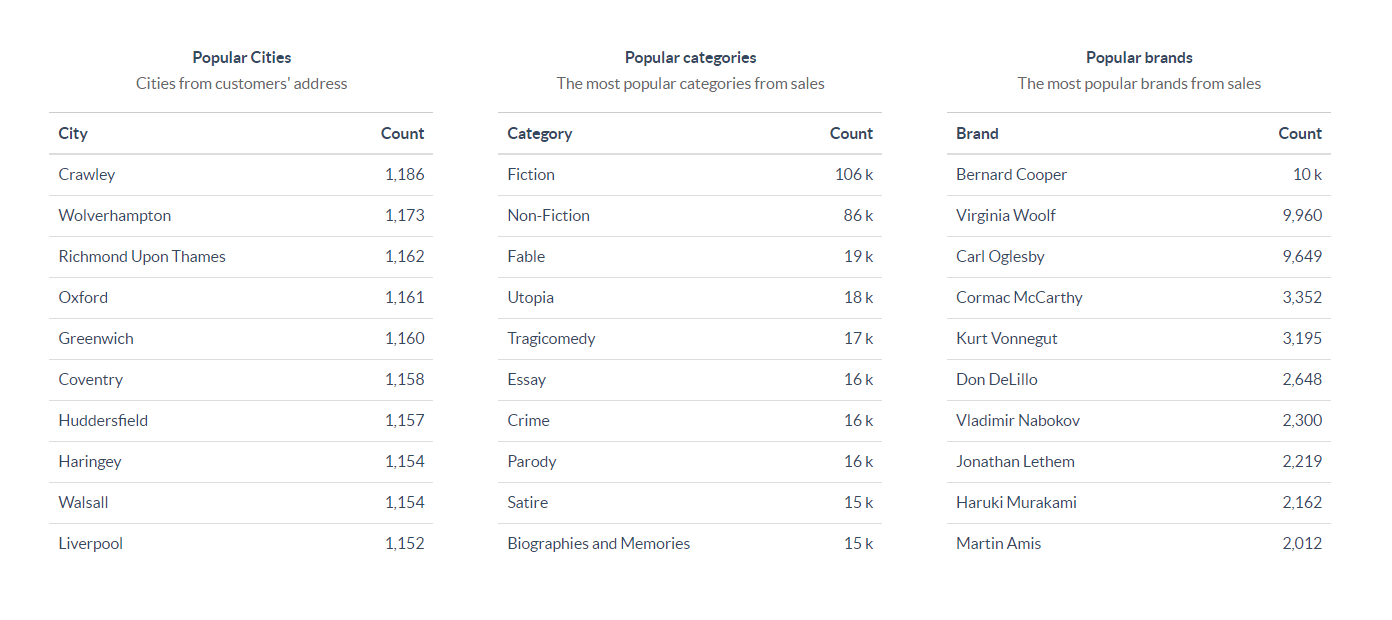
Popular items
This section is the bottom of the Statistics page and allows you to see a ranking of the top cities, product categories or brands based on their respective customer counts.
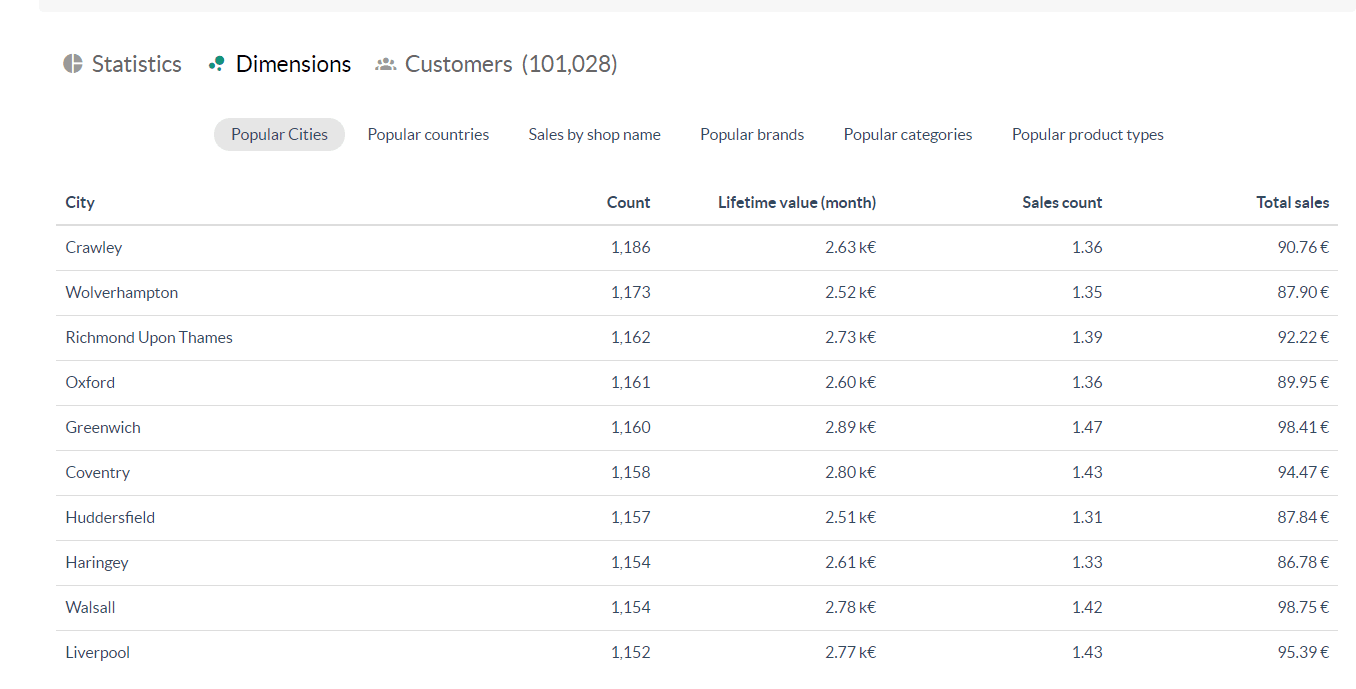
Dimensions
You can change the view of the page to show Dimensions instead of statistics. This consists of crossing two metrics and can be used for a deeper dive in your customers behavior or as a tool for reporting. Dimensions can be used to get a breakdown of the average revenue or sales counts per city or product types for example.
All figures in the dimensions section always describe the current audience you have active in the audience builder. They are:
- Count: Number of customers in the audience with the given parameter in case of “Cities” and “Countries” in case of sales related tabs, the count refers to the number of sales.
- Lifetime value (month): calculated comparison value for these customers of what their average lifetime value is.
- Sales count: Average number of purchases of these customers.
- Total sales: Average total life time spent of these customers.
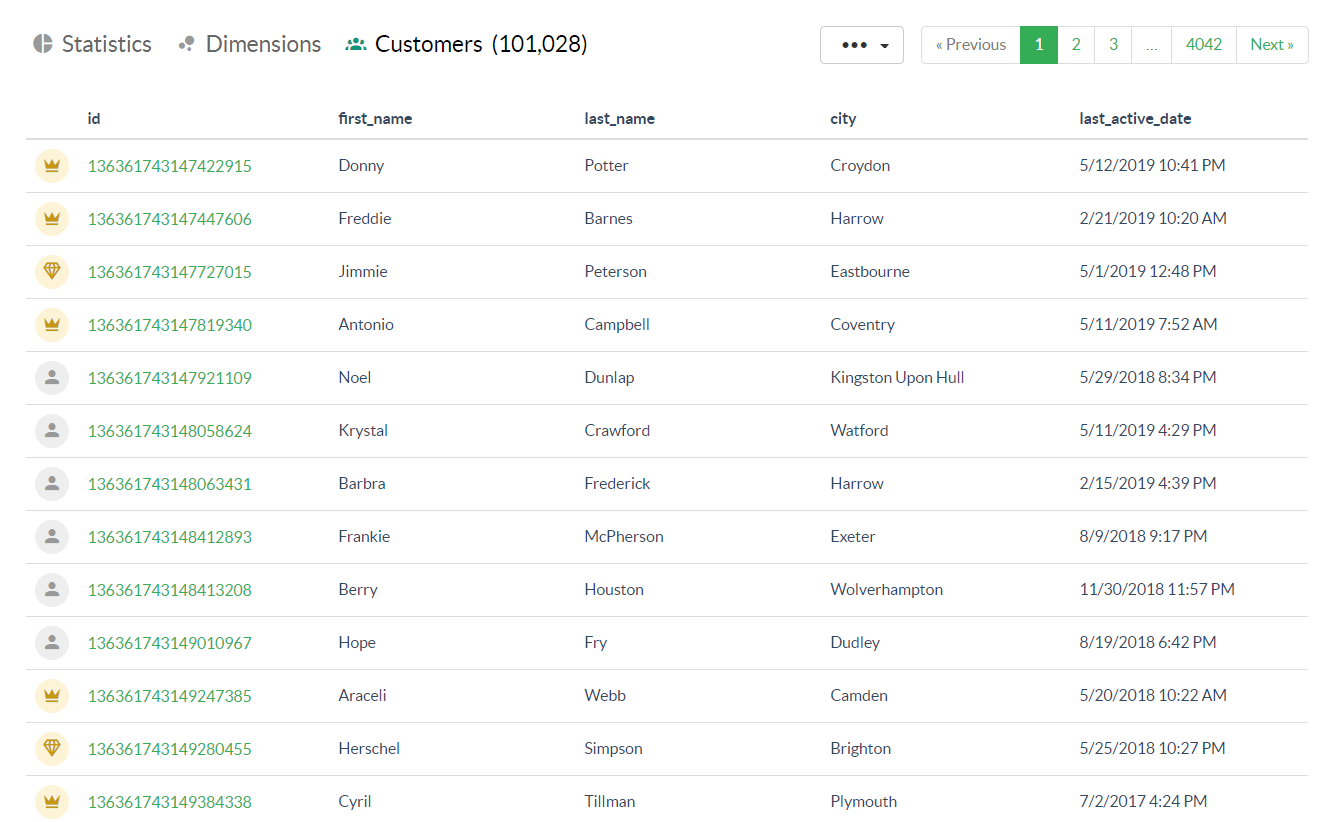
Customers
The Customers section allows you to see a sample of your customers or of your selected audience. The number in brackets indicates the count of customers in your account or in the selected audience. The sample shows the Customers ID, their name, city and last active date.
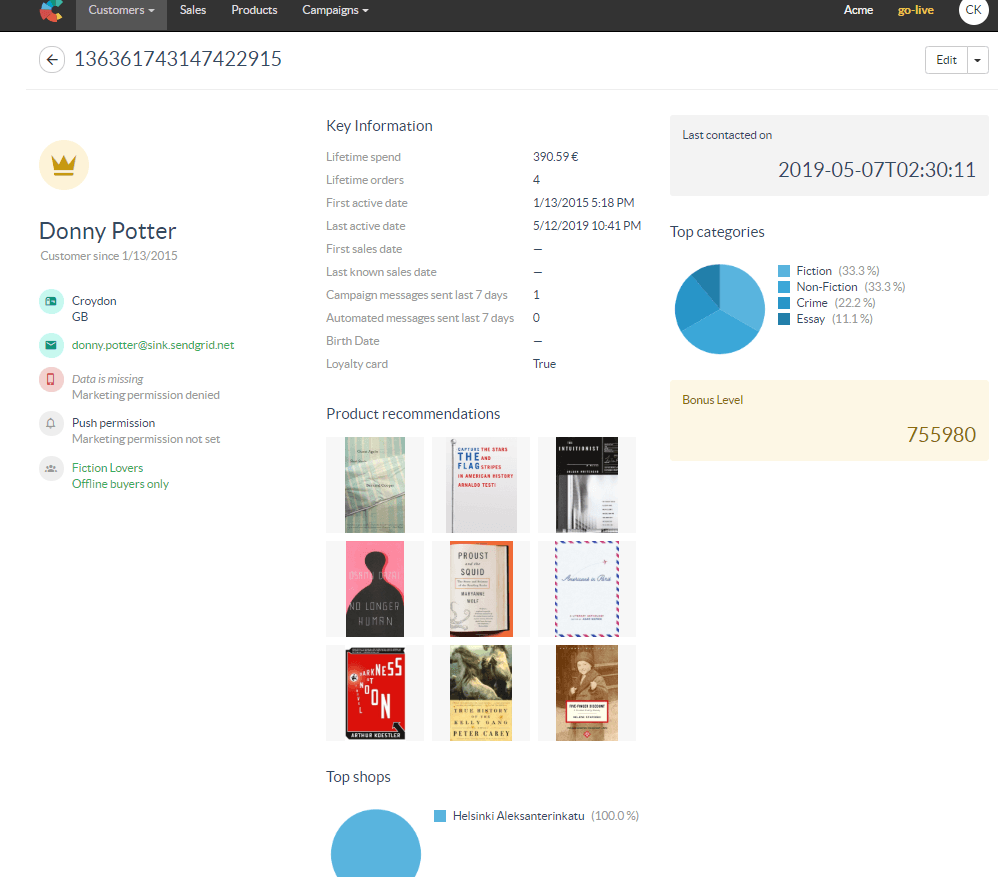
Customer 360° view
Clicking on a customer's ID will open the customer's 360° view. This is the view where you can find all the information relative to a unique customer.
There you can find their contact details, Marketing permissions status, the last time you contacted them, products recommendations for this specific customer if enabled and the value in any specific field from the data you send to Custobar.
Scrolling down, you can see the customer's timeline. You can use the cursors to define the time-window you would like to observe in the timeline. It is also possible to filter the entries in the timeline to see only Campaigns activities, the customer's own activity, Sales activity or Satisfaction survey feedback if enabled.
The timeline groups related entries together, for example email opens and clicks for the same campaign. You can also configure the timeline to group events and entries the way that suits you best and add labels to your custom events.
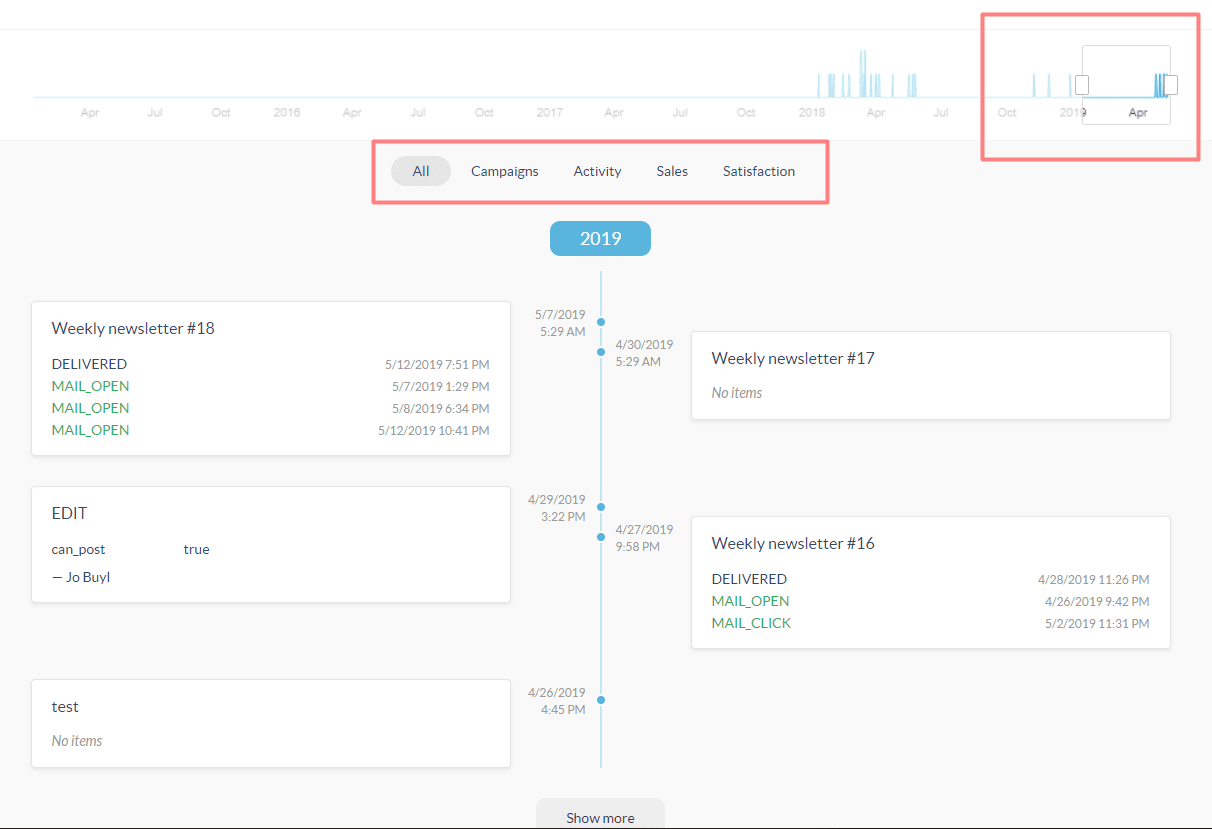
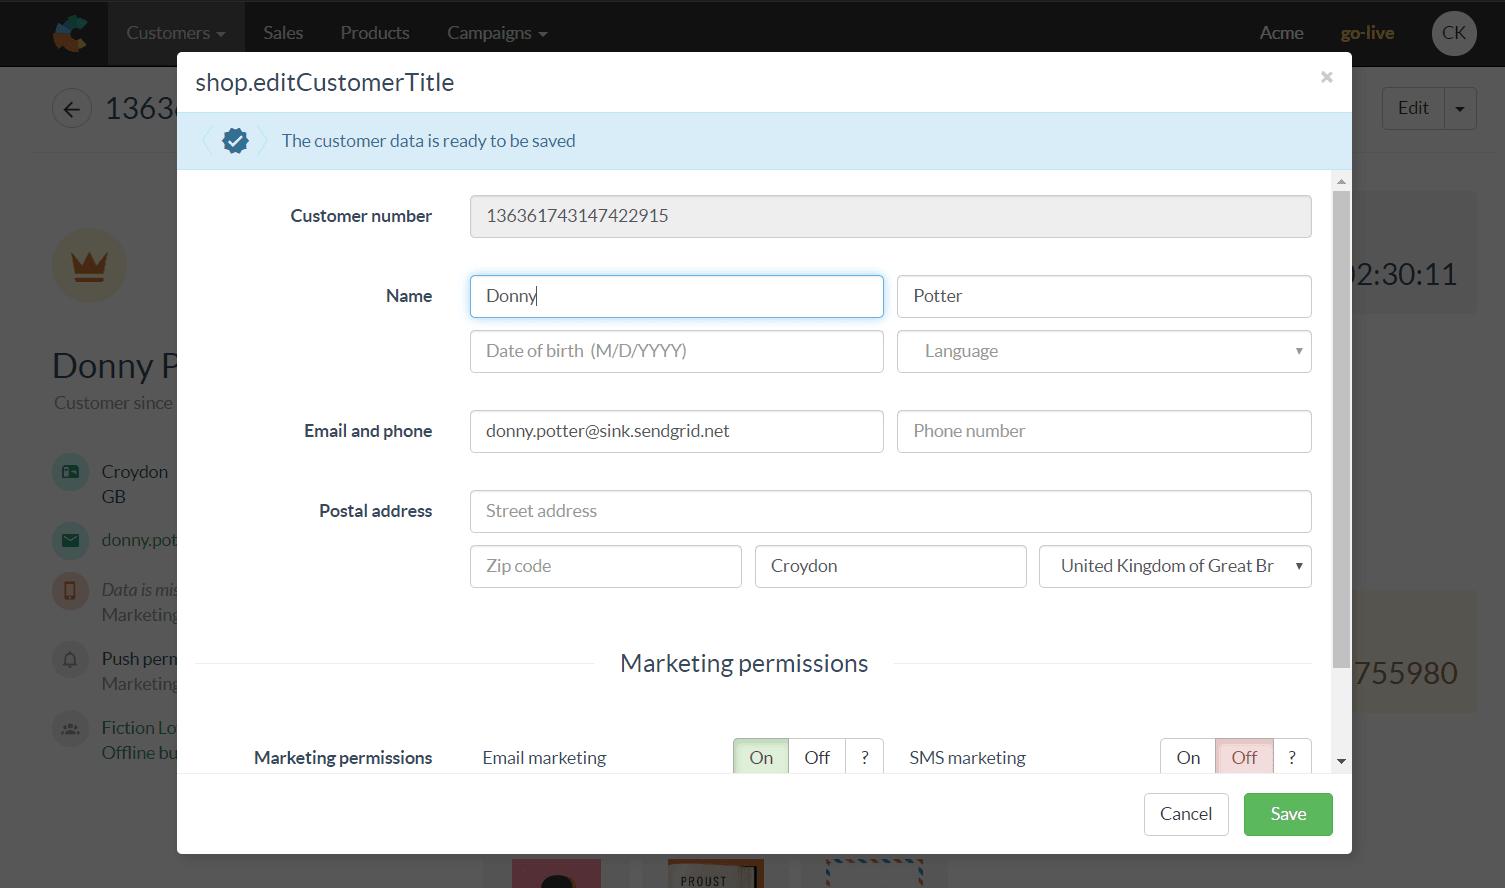
Finally, the Edit button in the upper right corner allows you to modify any field to reflect changes in the customer's data. When used as a CRM tool, those changes will then be passed on to your own database to update the data there and reflect the changes in Custobar. Editing the data is done in a form where you can directly type values, switch on or off permissions, etc.
The 360° view is fully configurable. For more information, please refer to this article.
If you have any questions or concerns, please contact Custobar support.